Analyze data related to the evolution of our climate
Brief description
This page lists interactive tools and data sources related to our changing climate. It also allows us to understand how to fight against climate change.
Carbon accounting
- Climate Trace: What are the most CO2 emitting industries in each country?
- Electricity map: How much CO2 is in our electricity? Is it really “green”?
- Footprint map: How much CO2 is emitted per person and per country, including the import of products and services?
- Climobil: How many CO2 emissions are avoided by driving an electric car?
- OurWorldInData: What proportion of renewable energy do we consume in Luxembourg?
- Global Carbon Atlas : How can we visualise the latest data on carbon flows generated by human activities and natural processes?
Environmental analysis
- Global Temperature Trend Monitor: When will we exceed 1.5°C of global average temperature increase?
- CO2 monitor: What is the current and historical CO2 concentration in our atmosphere?
- Coastal Risk Screening: How much land will be submerged by rising seas?
Reports
- Carbonnerd: How can we decarbonize and reach net zero in Luxembourg by 2050?
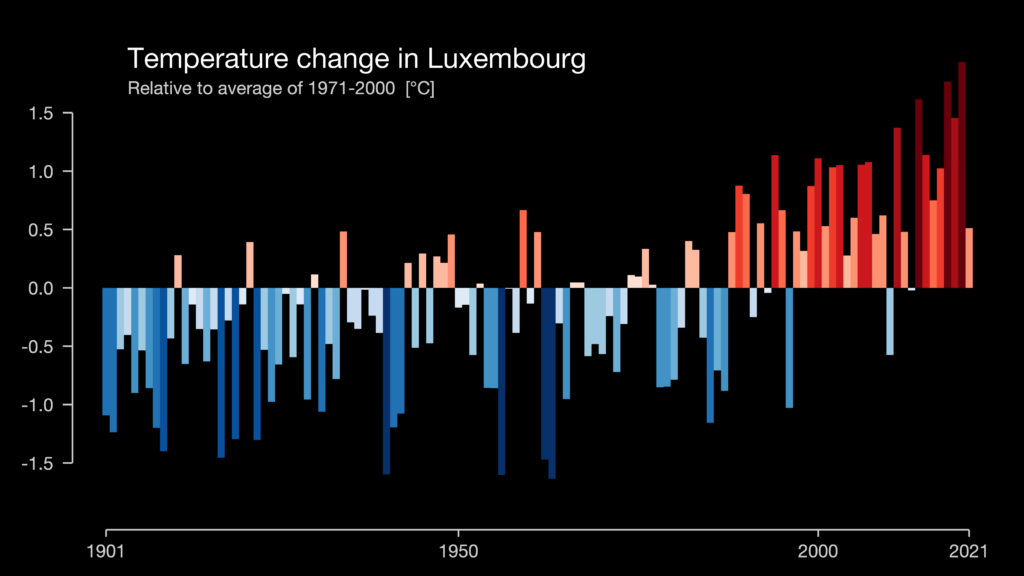
- Warming stripes: What is the average temperature increase in Luxembourg since 1900?
- Climate Action Tracker: Are policy decisions succeeding in limiting global warming to 1.5°C?